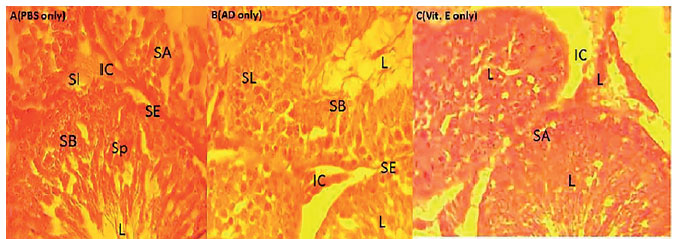
Plate A. Demonstrates testis of animal treated with o.5ml PBS only (control); all the stages of the spermatogonia population expressed, SB-Spermatogonia, SA- Spermatogonia B, SE-Seminiferous Epithelium, IC-Interstitial Cells, SL- Sertoli Cells. H&E stain, x400
Plate B. Indicates testis of animal treated with 800mg/kg A.D.; the seminiferous tubules closely apposed and all the stages of the spermatogonia population expressed, SB- Spermatogonia, SA-Spermatogonia B, SE-Seminiferous Epithelium, IC-Interstitial cells, SL- Sertoli cells. Indication of continuous spermatogenesis with the presences of spermatocytes in the lumen H&E stain, x 400
Plate C. Indicates testis of animal treated with 300mg/kg Vit. E; Loosening of the seminiferous tubules close apposition, mild alteration in the all architecture seen in the loosening of the SE-Seminiferous Epithelium. However, all the stages of the spermatogonia population expressed, SB-Spermatogonia B, SESeminiferous Epithelium, IC- Interstitial cell, SL- Sertoli cells. Indication of continuous spermatogenesis with the presence of spermatocytes in the lumen H&E stain, x 400