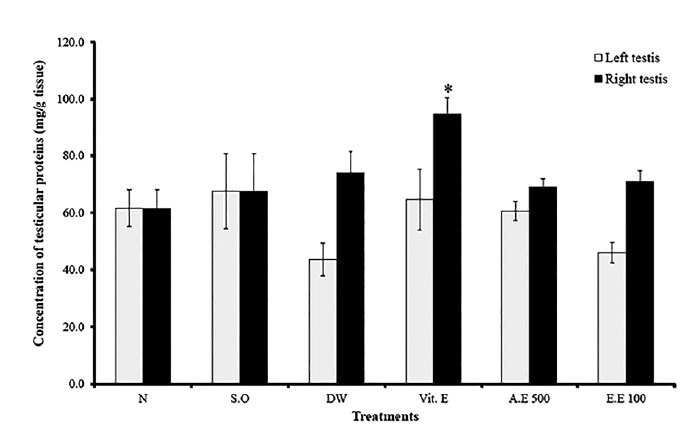
Figure 3. Effects of different treatments on testicular protein levels. Values are mean ± SEM. *: p<0.05 compared to distilled water; N: normal; S.O: sham operated; DW: distilled water; Vit E: vitamin E; A.E: aqueous extract; E.E: ethanolic extract.
Figure 3. Effects of different treatments on testicular protein levels. Values are mean ± SEM. *:
p<0.05 compared to distilled water; N: normal; S.O: sham operated; DW: distilled water; Vit E: vitamin E;
A.E: aqueous extract; E.E: ethanolic extract.