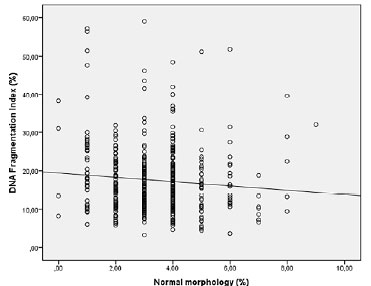
Figure 2. Correlation between Normal morphology and DFI. Individual data points and the regression line are shown. Spearman's correlation coefficient= -0.100 p=0.040.
Figure 2. Correlation between Normal morphology and DFI. Individual data points and the regression line are shown. Spearman's correlation coefficient= -0.100 p=0.040.