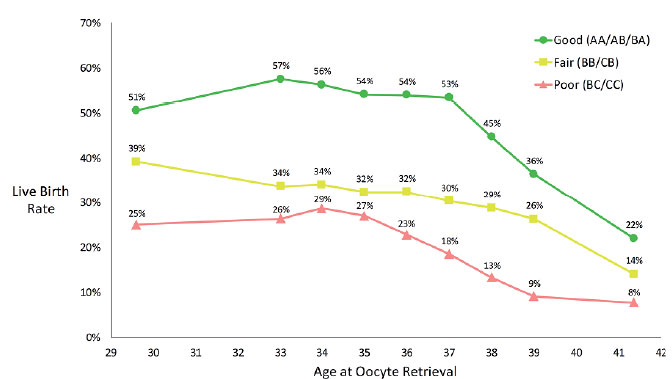
Figure 3. Live birth rates per blastocyst by age and overall morphology grade. 7-year moving groups are utilized for ages 33-39 years. Ages 25-32 years (average age 29.6) and 40-44 years (average age 41.4) are grouped as fixed groups. Linear interpolation is used to center live birth rates on the age of interest for ages 33-39 years.