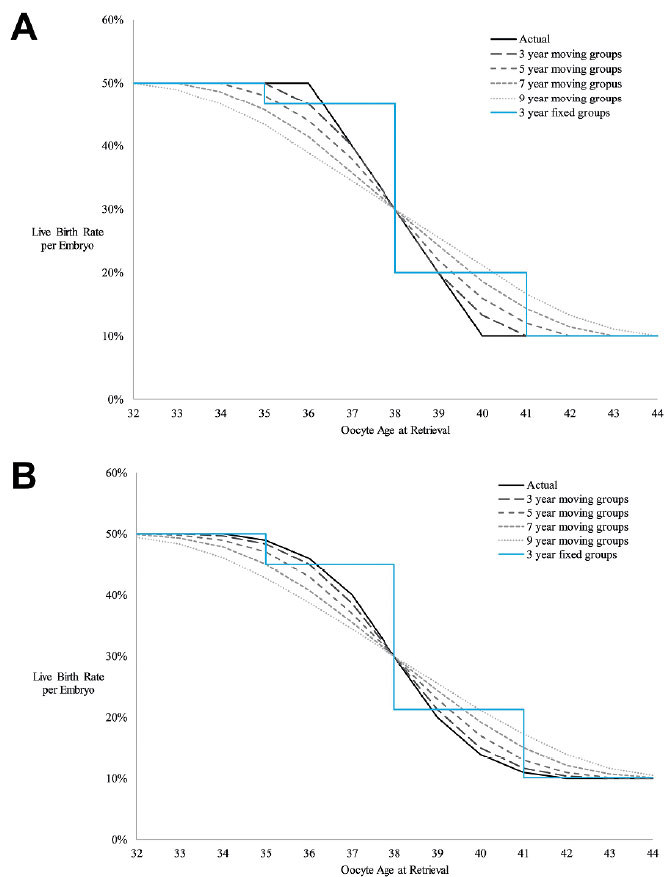
Figure 4. Demonstration with example data of the effect of 3-year fixed and 3, 5, 7, and 9-year moving groups on predicted live birth rates for (A) abrupt changes in live birth rate with age and (B) gradual changes in live birth rate with age.
Figure 4. Demonstration with example data of the effect of 3-year fixed and 3, 5, 7, and 9-year moving groups on predicted live birth rates for (A) abrupt changes in live birth rate with age and (B) gradual changes in live birth rate with age.