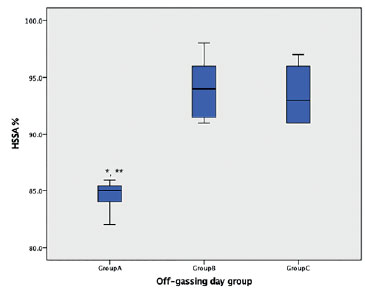
Figure 1. HSSA from the off-gassing groups. The value represents HSSA index multiple by 100%. Bonferroni multiple comparison. The mean difference is significant at the 0.05 level. *Group A and B significantly different. **Group A and C significantly different.