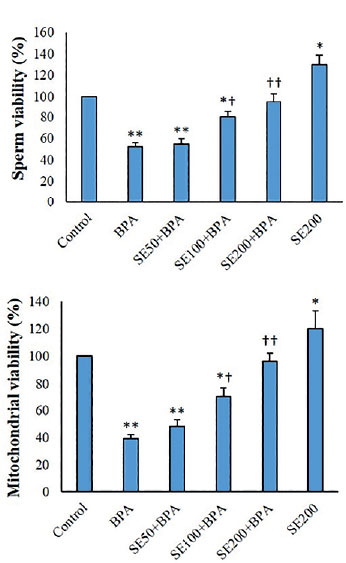
Figure 2. Viability of mitochondrial fractions and spermatozoa (mean ± SD; n=6).* p<0.05, **p<0.01, †p<0.05, ††p<0.01; *and †indicate comparisons against untreated control and BPA-treated groups, respectively.
Figure 2. Viability of mitochondrial fractions and
spermatozoa (mean ± SD; n=6).* p<0.05, **p<0.01,
†p<0.05, ††p<0.01; *and †indicate comparisons against
untreated control and BPA-treated groups, respectively.