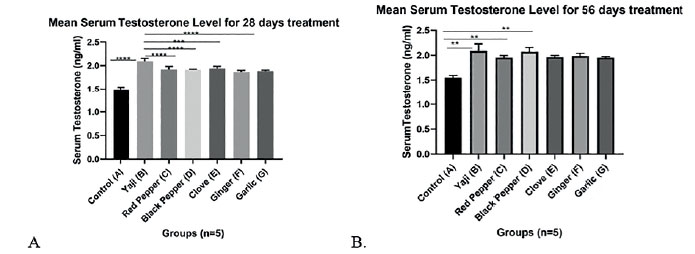
Figure 4. Graphical Representation of Mean Serum testosterone level (mg/ml) of Adult Sprague-Dawley rats treated for 28 and 56 days. Data analyzed using one-way ANOVA and expressed as Mean±Standard Deviation (Mean±SD). In the group treated for 28 days (Figure 4A), we observed a significant difference in Control (A) vs. Yaji (B) (****p<0.0001), Yaji (B) vs. Red Pepper (C) (****p<0.0001), Yaji (B) vs. Black Pepper (D), (****p<0.0001), Yaji (B) vs. Ginger (F), Yaji (B) vs. Garlic (G) (**** p<0.0001), and Yaji (B) vs. Cloves (E) (***p=0.0004); in the group treated for 56 days (Figure 4B), a significant difference was found in Control (A) vs. Yaji (B),(**p=0.0063); no significant difference was found in Yaji (B) vs. Red Pepper (C), Yaji (B) vs. Black Pepper (D), Yaji (B) vs. Ginger (F), Yaji (B) vs. Garlic (G), or Yaji (B) vs. Cloves (E).