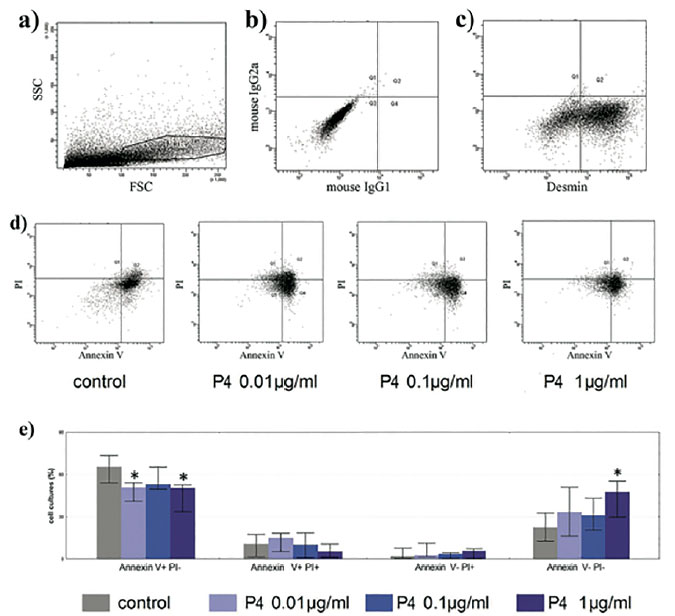
Figure 2. Effect of progesterone treatment on the apoptosis of primary leiomyoma cells Dot plot pictures of flow cytometry assessment of leiomyoma cell apoptosis (a-d). Gate was built on the FSC (forward light scatter) vs. SSC (side light scatter) dot plot (a) to analyze cells with predominantly smooth muscle features, confirmed with desmin staining (c). The cells were stained with anti-mouse IgG1-FITC and IgG2a- PE antibodies (negative control) to dicern positive from negative cells (b). Representative dot plot picture of flow cytometry data from Annexin test is shown at various progesterone (P4) concentrations (0.01μg/ ml, 0.1μg/ml and 1μg/ml) (d) Effect of different concentrations of progesterone (0.01μg/ml, 0.1μg/ml and 1μg/ml) on the relative content of early apoptotic (Annexn+PI-), late apoptotic (AnnexinV+Pi+) dead (Annexin V-Pi+) and viable (Annexin V-Pi-) leiomyoma cells (e). Error bars represent means ± SEM. *p<0.05, two-tailed Student’s t test with controls.