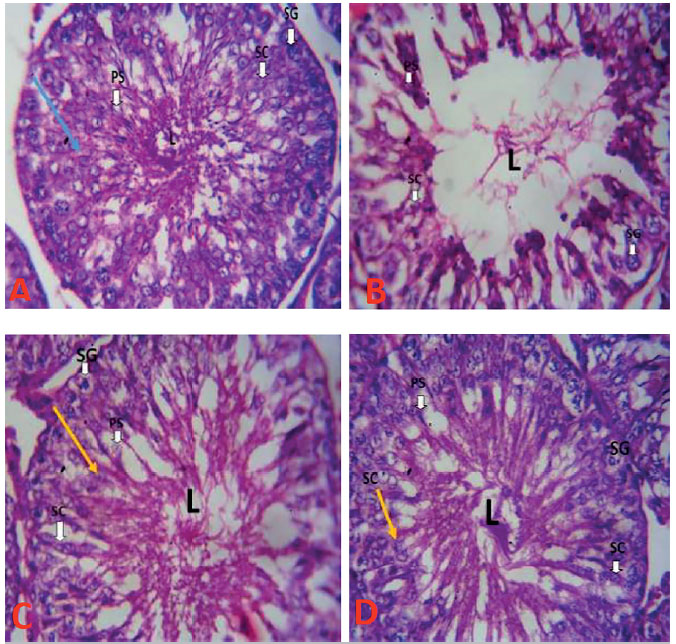
Figure 7. Testicular Photomicrographs showing the effects of MOE on HAART induced normal and experimental rats. Scale bar: 250µm. Stains: Hematoxylin and Eosin, Magnification X400. A: Group A showing testicular photomicrograph section of control rat with normal histoarchitecture of typically organized layers of Sertoli cells (arrow), no pathological changes in the lumen (L) of the seminiferous tubules, with prominent spermatogonia (SG), Primary spermatocyte (PS). B: Group B showing testicular photomicrograph section of HAART only group with distortion in the tubular architecture and disorganization of the Sertoli cells within the seminiferous tubules, hypocellularity of spermatogonia, disruption of spermatogenesis and empty lumen (L). C: Group C showing testicular photomicrograph section of MOE and HAART treated group at low dose with visible restored lumen (L), spermatogonia (SG), Primary spermatid (PS) and abundant Sertoli cell (yellow arrow). D: Group D showing testicular photomicrograph section of MOE and HAART treated group at high dose showing visible lumen (L), spermatogonia (SG), Primary spermatid (PS) and abundant Sertoli cell (yellow arrow).