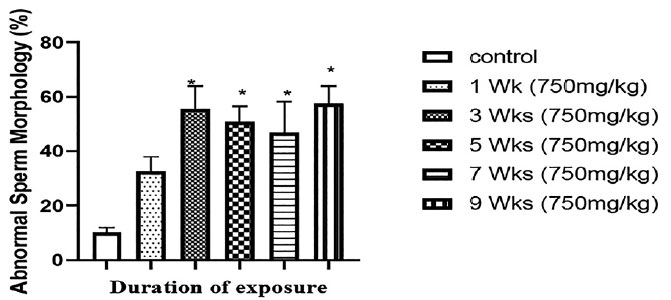
Figure 5. Effects of different lengths of exposure to phthalate on sperm morphology in male Wistar rats Values are expressed as Mean ± SEM (n=7) (One-way ANOVA followed by Tukey’s post hoc test). *p<0.05 considered statistically significant when compared with controls.