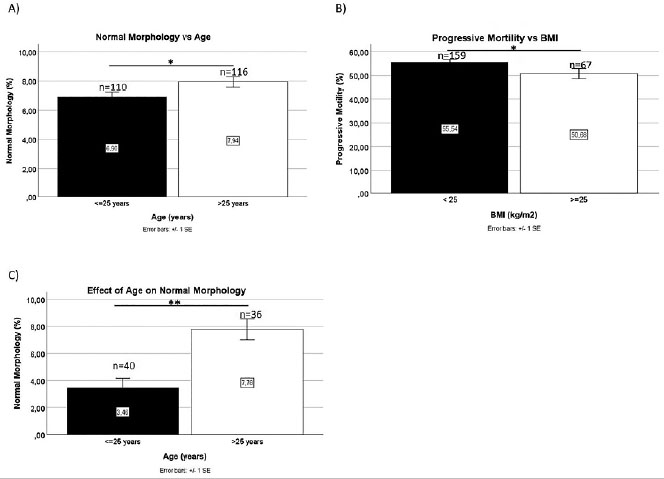
Figure 2. Mean values of Normal Morphology as a function of age (A) and Progressive Motility as a function of BMI (B); effect of Age on Normal Morphology in non-normozoospermic men (C); *p<0.05, **p<0.01.
Figure 2. Mean values of Normal Morphology as a function of age (A) and Progressive Motility as a function of BMI (B); effect of Age on Normal Morphology in non-normozoospermic men (C); *p<0.05, **p<0.01.