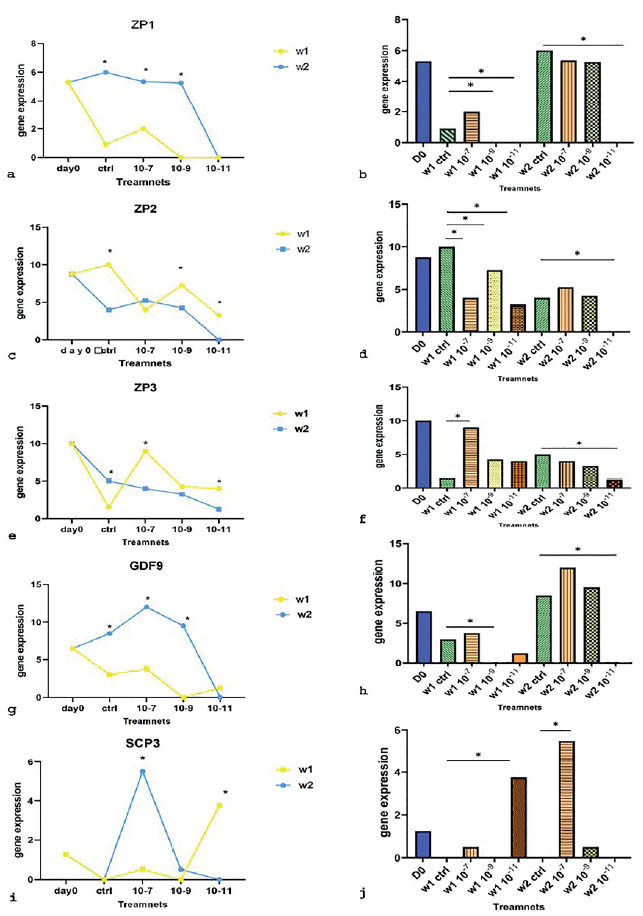
Figure 7. qRT-PCR analysis of ZP1(a, b), ZP2(c, d), ZP3(e, f), GDF9(g, h) and SCP3(I, j). mRNA expression. of human FF-derived OLCs on day 0, week 1(w1) and week 2(w2) in melatonin treatment groups (10-7, 10-9,10-11M) compared with control groups; gene expression at a specific concentration in week 1 compared to week 2 (a, c, e, g, i); gene expression of melatonin treatment groups compared with control groups each week (b, d, f, h, j); *: p<0.05.