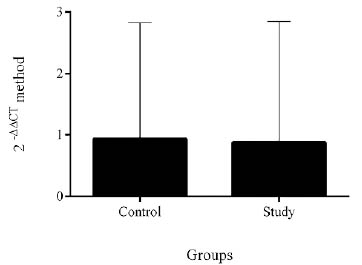
Figure 1. p63 gene expression in between the groups. Legend: Comparison of p63 gene expression between the control and study groups showing no statistical difference between them (p>0.05); qPCR results were evaluated by the 2-ΔΔCT method and the results are shown as relative quantification (RQ) in the Y-axis; The control group showed an RQ of 1.000 and 0.431 and 2.323 minimum and maximum RQ, respectively; The study group showed an RQ of 0.725 and 0.249 and 2.105 minimum and maximum RQ, respectively.