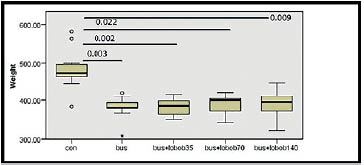
Figure 2. Result of post-hoc test (Dunn-Bonferroni) comparing each treated group in the aspect of body weight. P-values between the groups are shown on the line drawn to connect every compared two columns.
Figure 2.
Result of post-hoc test (Dunn-Bonferroni) comparing each treated group in the aspect of body weight. P-values between the groups are shown on the line drawn to connect every compared two columns.