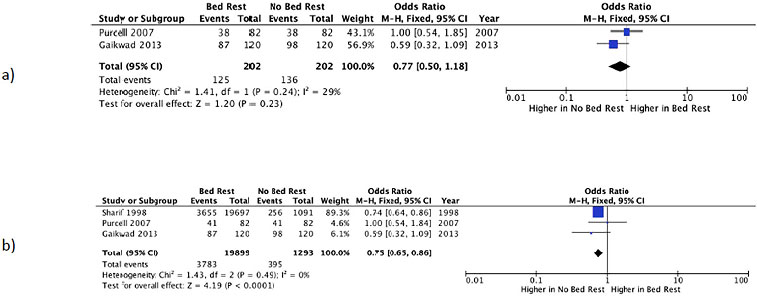
Figure 3. Forest plot of the comparison of bed rest vs. no bed rest after embryo transfer. Analysis: a) Live Birth Rate; b) Clinical Pregnancy Rate.
Figure 3. Forest plot of the comparison of bed rest vs. no bed rest after embryo transfer. Analysis: a) Live Birth Rate; b) Clinical Pregnancy Rate.