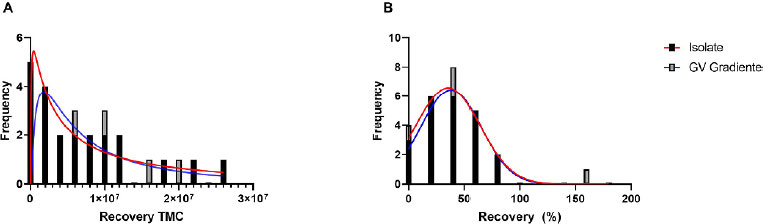
Figure 4. Frequency histograms of the distribution of the evaluated samples. (A) Frequency histogram of motile sperm counts (TMSC) after separation with density gradient media evaluated with a log-normal distribution curve. (B) Frequency histogram of the percentage of sperm recovered after separation with density gradient media with a normal distribution curve.