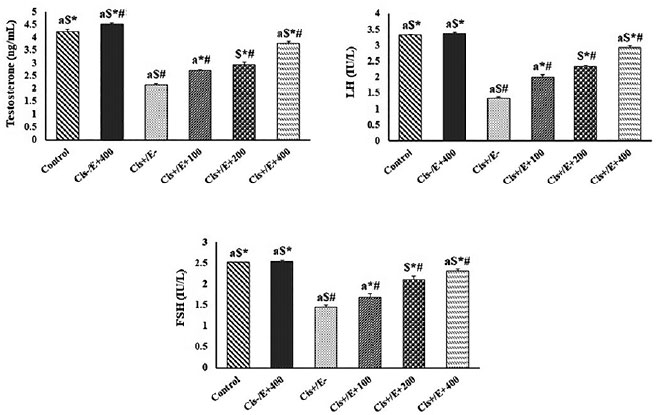
Figure 3. The levels of the biochemical hormonal marker for testes damage in different studied group
#: p<0.05 vs. control group,
*: p<0.05 vs. Cis+/AO
$: p<0.05 vs. Cis+/AO+100
a: p<0.05 vs. Cis+/AO+200.
Figure 3. The levels of the biochemical hormonal marker for testes damage in different studied group
#: p<0.05 vs. control group,
*: p<0.05 vs. Cis+/AO
$: p<0.05 vs. Cis+/AO+100
a: p<0.05 vs. Cis+/AO+200.