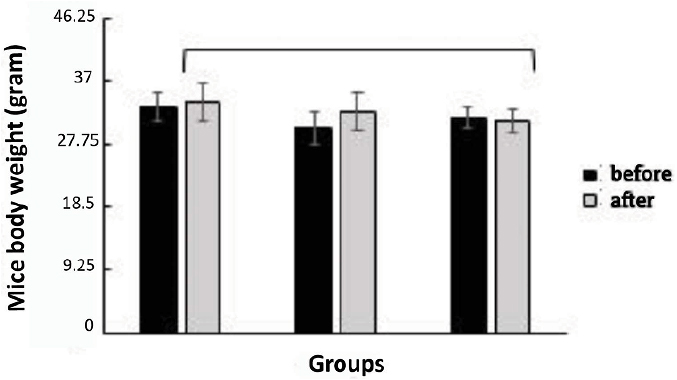
Figure 2. Average body weight of mice in all research groups before and after soybean administration treatment: the group with a 50:50 ratio of soybean to pelleted feed (K1), the group with a 25:75 ratio of soybean to pelleted feed (K2), and the control group without soybean administration (K3). The error bar indicates standard deviation (SD), ts=not significant, one-way ANOVA and paired t-test. Figure