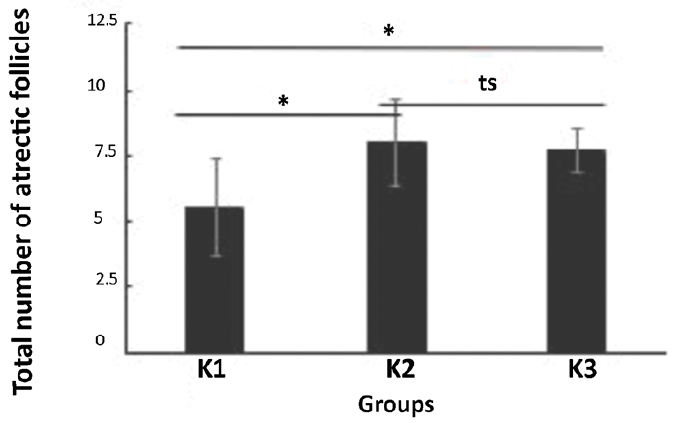
Figure 5. The total number of atretic follicles in the ovaries of mice for all the study groups: the group with a 50:50 ratio of soybean to pelleted feed (K1), the group with a 25:75 ratio of soybean to pelleted feed (K2), and the control group without soybean administration (K3). The error bar indicates standard deviation (SD). *p<0.05, ts=not significant, one-way ANOVA.