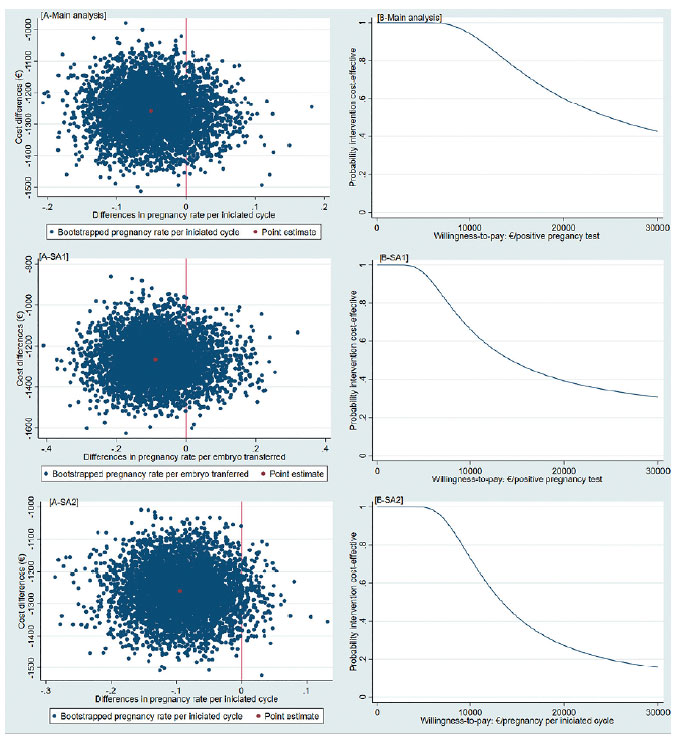
Figure 2. Cost-effectiveness planes [A] and Cost-effectiveness acceptability curves [B]
[A-Main analysis] Cost-effectiveness plane indicating the uncertainty around the point estimate of the incremental cost-effectiveness ratio regarding pregnancy rate per initiated cycle
[B-Main analysis] Cost-effectiveness acceptability curve indicating the probability of cost-effectiveness for different willingness-to-pay thresholds per a positive pregnancy test (initiated cycle)
[A-SA1] Cost-effectiveness plane indicating the uncertainty around the point estimate of the incremental cost-effectiveness ratio regarding pregnancy rate per embryo transfer
[B-SA1] Cost-effectiveness acceptability curve indicating the probability of cost-effectiveness for different willingness-to-pay thresholds per a positive pregnancy test (embryo transfer)
[A-SA2] Cost-effectiveness plane indicating the uncertainty around the point estimate of the incremental cost-effectiveness ratio regarding pregnancy rate per initiated cycle unadjusted
[B-SA2] Cost-effectiveness acceptability curve indicating the probability of cost-effectiveness for different willingness-to-pay thresholds per a positive pregnancy test (initiated cycle unadjusted for baseline characteristics) €: euros