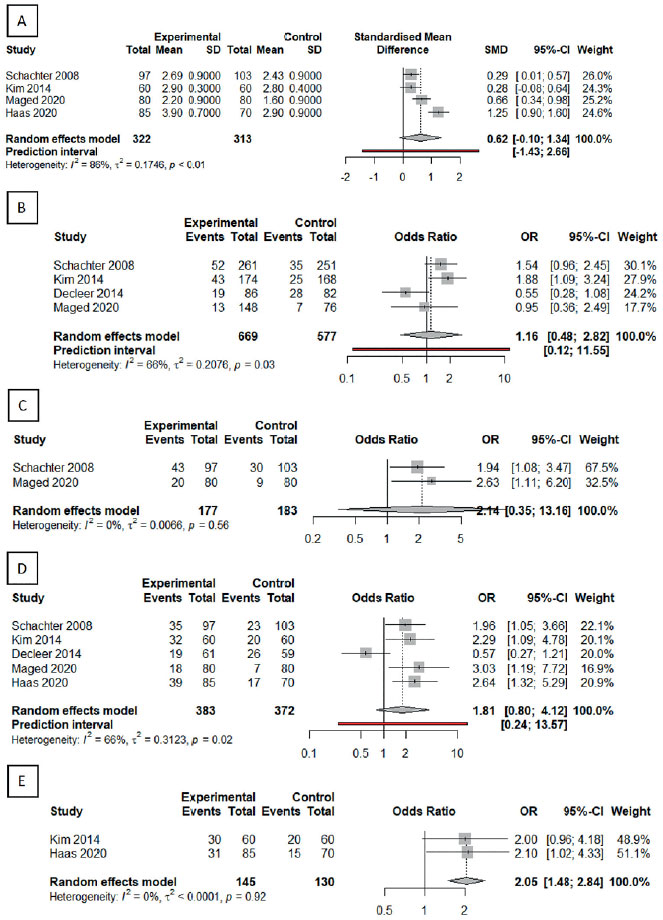
Figure 4. Forest plots comparing secondary outcomes between dual triggering and hCG-alone triggering. A: Number of embryos transferred. B: Implantation rate. C: Beta-HCG rate. D: ongoing pregnancy rate. E: New born rate.
Figure 4. Forest plots comparing secondary outcomes between dual triggering and hCG-alone triggering. A: Number of embryos transferred. B: Implantation rate. C: Beta-HCG rate. D: ongoing pregnancy rate. E: New born rate.