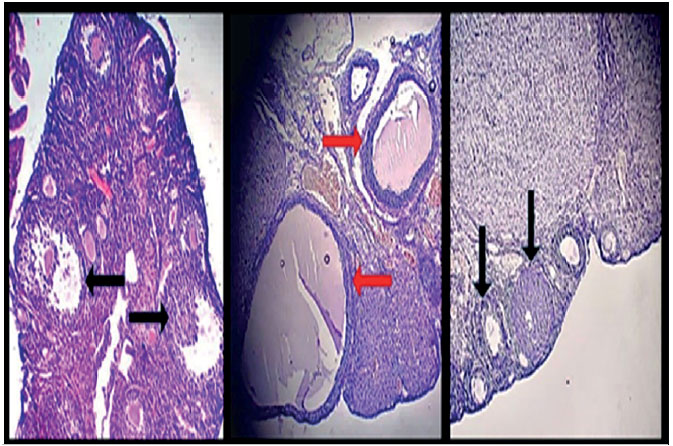
Figure 2. Ovarian cross section photomicrograph (H&E) of control, PCOS and treated groups with 200 mg/ kg hydroalcoholic extract of M. arvensis (T200 mg/Kg) with 400x magnification. Red arrows show the cysts in the PCOS group (middle image), and the black arrows represent a healthy follicle in the ovaries of control group (left image) and T200 group (right image) animals.