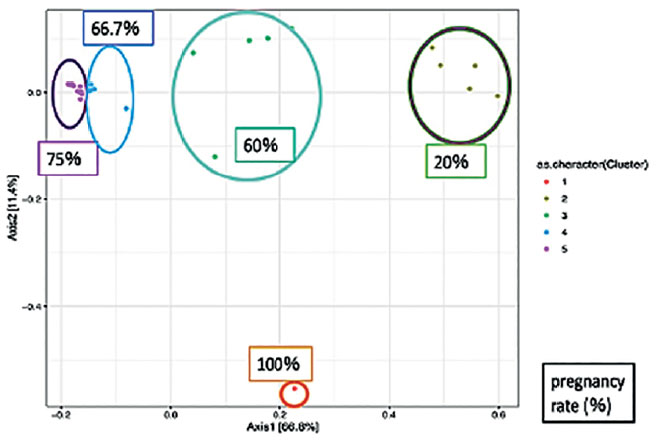
Figure 7b. PERMANOVA test of trends in the type of endometrial bacteria and pregnancy rate using cluster (PCoA plot). In the biplot and PCoA plots, each plot is identical. The percentages shown in the figures are pregnancy rates. A high Gardnerella spp. abundance resulted in a low pregnancy rate, whereas a high Lactobacillus abundance resulted in a high pregnancy rate (PERMANOVA test p=0.048).