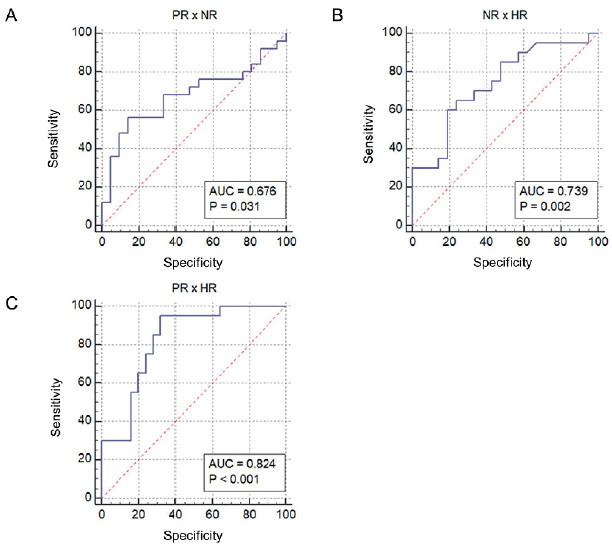
Figure 3. ROC curve of the serum levels of miR-181d-5p in the distinction between groups of response to EOC. (a) ROC curve of the PR x NR group ratio, showing AUC=0.676, p=0.031, standard error=0.0819, sensitivity=56, specificity, 85.71, cutoff ≤0.572. (b) ROC curve of the HR x NR group relationship, showing AUC=0.739, p=0.002, standard error=0.0079, sensitivity=65, specificity=76.19, cutoff> 1.327. (c) ROC curve of the PR x HR group ratio, showing AUC=0.824, p<0.001, standard error=0.063, sensitivity=95, specificity=68, cutoff>0.675. (NR, normal response; PR, poor response; HR, high response; AUC, area under the curve).