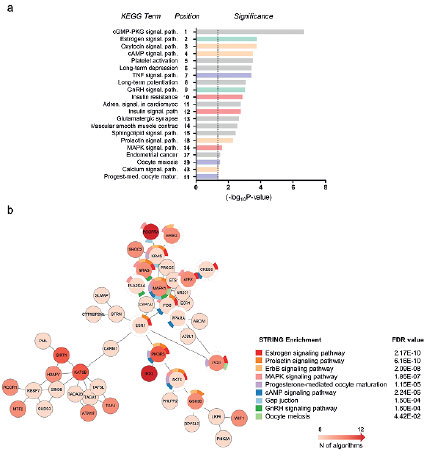
Figure 5. Gene set enrichment analysis of miR-181-5p targets. A representative list of the top 15 Kegg GO terms and other relevant terms enriched among miR-181d-5p targets. (a) The list of predicted targets of miR-181d-5p was obtained using the miRWalk tool and was subjected to gene set enrichment analysis using the DAVID annotation tool. The enriched Kegg GO terms are shown to the left side of the graph. The bars represent -log10 p-values and the dashed line indicates statistical significance (p=0.05). The position of the Kegg GO terms on the list of enriched processes is shown on the Y axis. (b) To construct the gene interaction network with gene enrichment of miR-181d-5p, we used targets that were predicted by at least 8 from 12 algorithms, with no additional interactions and with a confidence interval of 0.95.