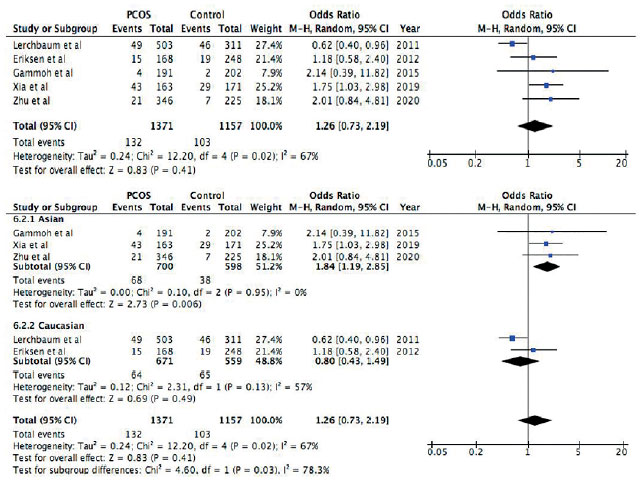
Figure 4
Figure 4. Forest plot of the association between rs2479106 polymorphism and PCOS in a recessive model (GG vs. GA+AA). First forest plot: Total analysis of all included studies. Second forest plot: Subgroup analysis based on ethnicity, both Asians and Caucasians. Solid squares are OR from individual studies, horizontal lines are 95% CI. Pooled OR with 95% CI are presented in diamonds.

Figure 4

Figure 4
Figure 2. Forest plot of the association between rs6165 polymorphism and PCOS in allelic model (first forest plot, Ala vs. Thr), recessive model (second forest plot, Ala/Ala vs. Ala/ Thr+Thr/Thr) and dominant model (third forest plot, Ala/Ala+Ala/Thr vs. Thr/Thr). Solid squares are OR from individual studies, horizontal lines are 95% CI. Pooled OR with 95% CI are presented in diamonds.