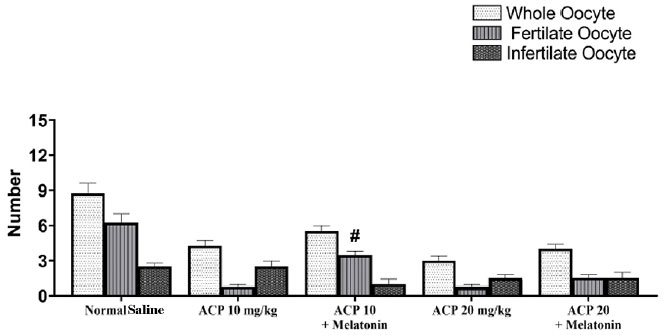
Figure 4. Mean number of total oocytes and number of fertile and infertile oocytes. Data are in the form of means ± standard deviation. (#)indicates a significant difference in relation to the gorup given saline. (p=0.05).
Figure 4. Mean number of total oocytes and number of fertile and infertile oocytes. Data are in the form of means ± standard deviation. (#)indicates a significant difference in relation to the gorup given saline. (p=0.05).