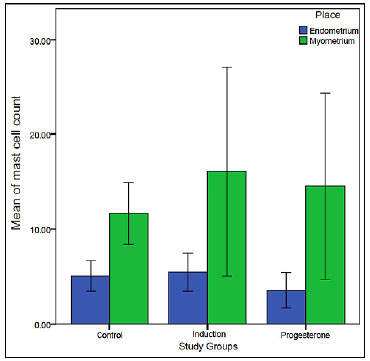
Figure 2. The mean of mast cell count per area among the groups and places. No significant difference was observed (ANOVA). The error bars indicate 95% CI.
Figure 2. The mean of mast cell count per area among the groups and places. No significant difference was observed (ANOVA). The error bars indicate 95% CI.