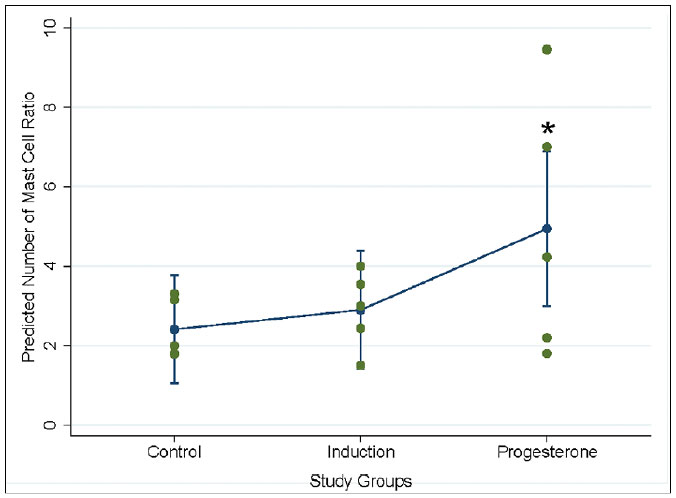
Figure 3. Poisson regression for prediction of mast cell count ratio in myometrium per endometrium (the plot is marginal post estimation output of the regression, Stata14). The error bars indicate 95% CI. * Significant difference considering the control group as the base.