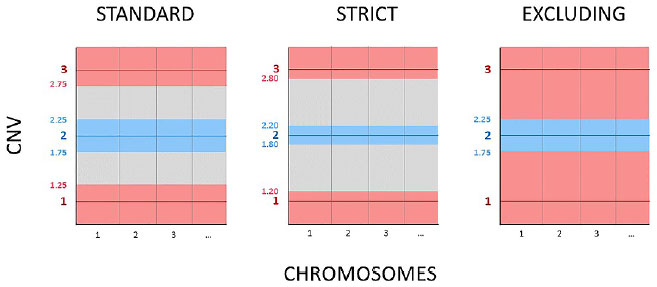
Figure 1. Simplified comparison of the thresholds used by the three criteria evaluated in this study for the interpretation of PGT-A blastocysts. Blue area: euploid range, grey area: mosaic range, red area: aneuploid range. CNV= copy number value.
Figure 1. Simplified comparison of the thresholds used by the three criteria evaluated in this study for the interpretation of PGT-A blastocysts. Blue area: euploid range, grey area: mosaic range, red area: aneuploid range. CNV= copy number value.