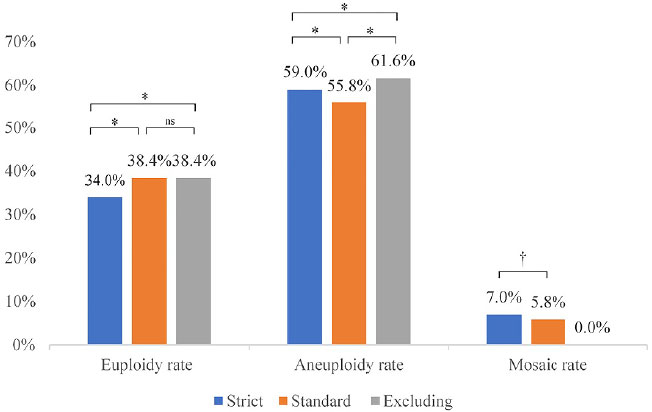
Figure 2. Euploidy, aneuploidy and mosaic rates per PGT-A cycle depending on the diagnostic criteria used. *p<0.001, †p<0.05, ns: not significant.
Figure 2. Euploidy, aneuploidy and mosaic rates per PGT-A cycle depending on the diagnostic criteria used. *p<0.001, †p<0.05, ns: not significant.