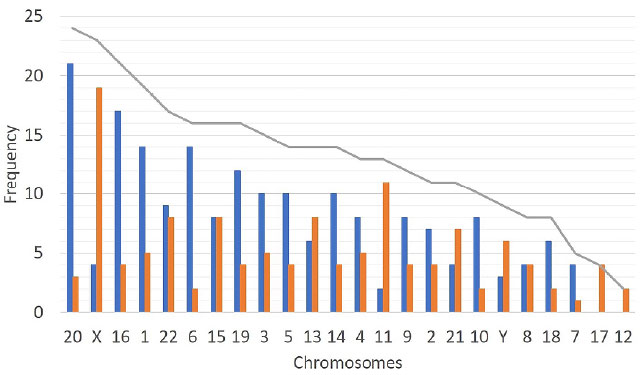
Figure 3. Incidence of chromosomes with intermediate copy number (putative mosaic chromosomes) in the preimplantation blastocysts analyzed (grey line) and the genomic alteration: trisomies (blue bars) and monosomies (orange bars). For the X chromosome, the blue bar represents mosaic XXX embryos and the orange bars mosaic X embryos. For the Y chromosome, the blue bar represents a CNV ≥ 1.25 and orange bar a CNV ≤ 0.75.