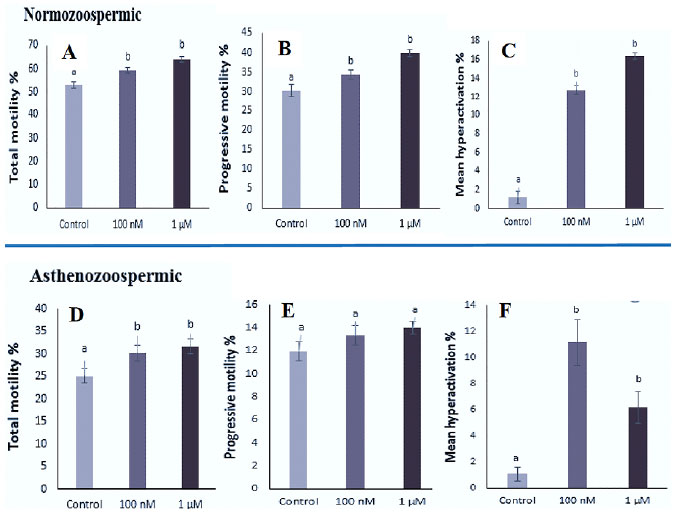
Figure 3. Effects of different concentrations of repaglinide (control, 100 nM and 1µM) on (A, D) Total motility; (B, E) Progressive motility; (C, F) Hyperactivity in normozoospermic and asthenozoospermic groups
Data were expressed as means ± SEM (%)
a,b Indicates significant difference between the treatment and control groups (ANOVA test, p<0.05).