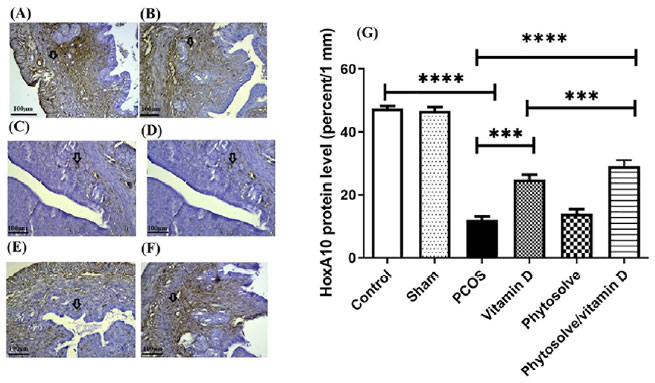
Figure 2. The expression of HOXA10 protein in endometrium from PCOS mice; The assay was performed by Immunohistochemistry technique. Data was presented as Mean ± SD (n=6 per every group). Internal control was done by β-actin. ***p<0.001, and ****p<0.0001. A: Control, B: Sham, C: PCOS, D: Vitamin D, E: Phytosolve, F: Phytosolve/ Vitamin D.