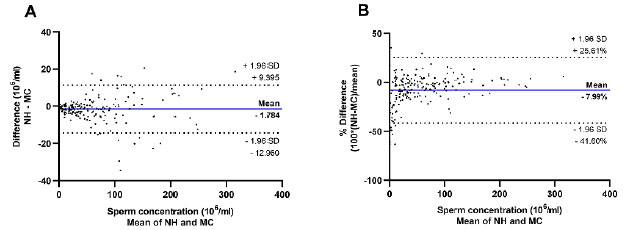
Figure 1. Bland and Altman plots showing mean difference (bold blue lines) and limits of agreement (mean difference ± 1.96 standard deviations (SD), dotted red lines) between sperm concentration estimated with Neubauer hemocytometer (NH) and Makler chamber (MC) as a function of (A) difference (106/ml) against mean (106/ml) and (B) percentage difference (%) against mean (106/ml).