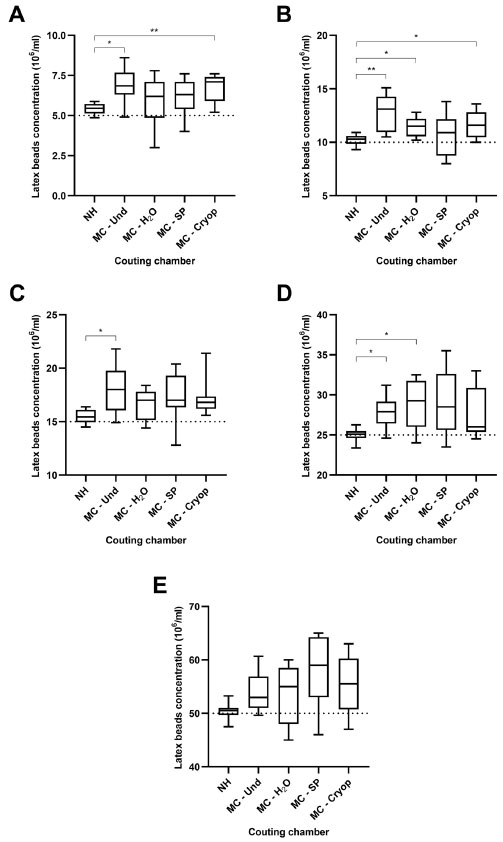
Figure 4. Box and whisker plot showing results of latex beads counts in Neubauer hemocytometer (NH), Makler chamber counts of undiluted latex beads (MC - Und), Makler chamber counts of latex beads diluted with water (MC - H2O), Makler chamber counts of latex beads diluted with seminal plasma (MC - SP) and Makler chamber counts of latex beads diluted with cryopreserver (MC - Cryop) of target concentrations of (A) 5x10⁶/ml, (B) 10x106/ml, (C) 15x106/ml, (D) 25x106/ml and (E) 50x106/ml. Box contains lower quartile (25th percentile), upper quartile (75th percentile), and median in the middle. Whiskers represent minimum and maximum. Dotted lines represent target concentration values. Significant difference between groups was determined with Welch ANOVA with Dunnett’s T3 multiple comparison post hoc test. p<0.05 (*); p<0.01 (**).