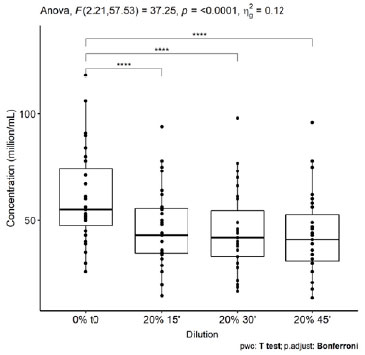
Figure S1. Boxplot of the ANOVA adjusted for multiple comparisons by Bonferroni test of the concentration of fresh samples.
Figure S1. Boxplot of the ANOVA adjusted for multiple comparisons by Bonferroni test of the concentration of fresh samples.