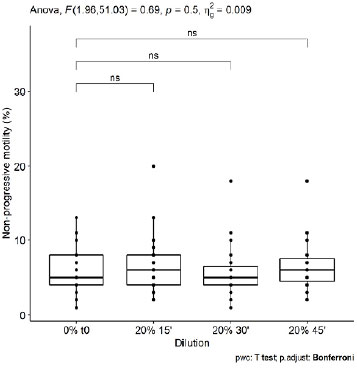
Figure S3. Boxplot of the ANOVA adjusted for multiple comparisons by Bonferroni test of the non-progressive sperm percentage of fresh samples.
Figure S3. Boxplot of the ANOVA adjusted for multiple comparisons by Bonferroni test of the non-progressive sperm percentage of fresh samples.