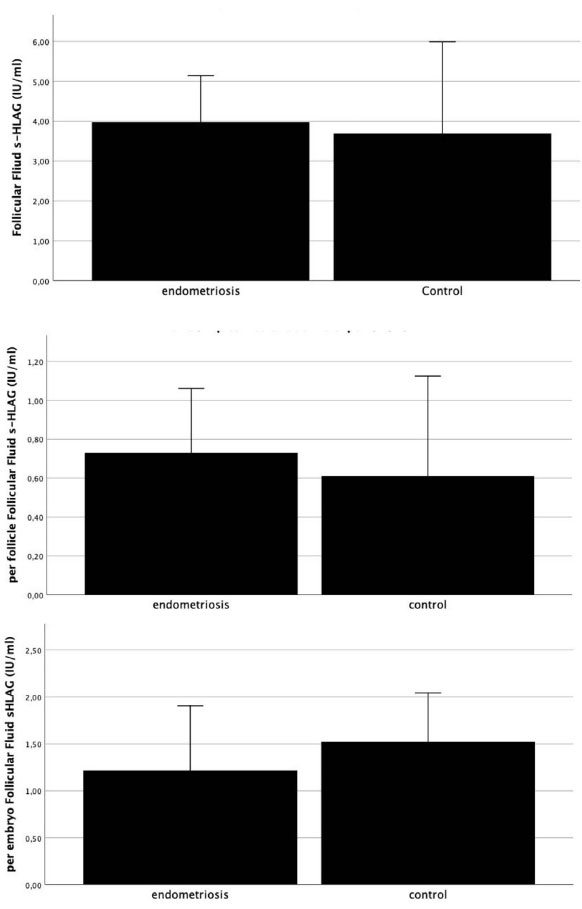
Figure 1. Follicular Fluid concentration of sHLA-G (IU/ml): a) in peritoneal endometriosis vs control group (non-endometriosis), p=0.682; b)comparing per follicle sHLA-G concentration between both groups, p=0.955 and (c) per embryo sHLA-G concentration (p=0.857), Mann- Whitney-U test.