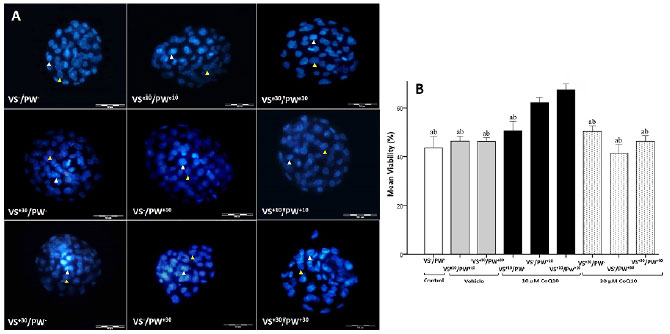
Figure 3. Assessment of blastocysts viability using vital staining. A. Representative image of blastocysts from the study groups. The blastocysts were stained by propidium iodide and Hoechst 33358, (dead blastomeres appear in light blue and shown with white arrowheads. Alive blastomeres shown with yellow arrowheads: magnification: ×400, scale bars: 50 µm). B. Comparison of mean viability in the study groups. All data is drawn from two replicates. Data are reported as Mean±SD. ab: significant difference between groups (p≤0.05).a vs VS+10/PW+10, b vs VS-/PW+10. VS: Vitrification Solution, PW: Post Warming, e10: presence of 10 µL/ml ethanol, e30: presence of 30 µL/ml ethanol, +10: presence of 10 µM CoQ10, +30: presence of 30 µM CoQ10, -: absence of CoQ10.