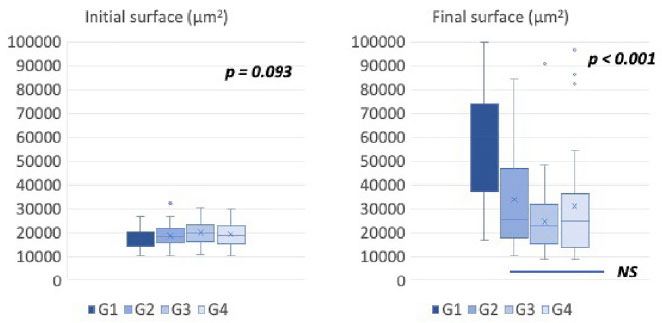
Figure 5. Boxplot representation of follicular surfaces in µm2 between the beginning (D1, left panel) and the end of the culture (D11, right panel) in the 4 conditions tested (G1: HSA 5% + ITS 1%, G2: PLTM 5% + ITS 1%, G3: HSA 10% + ITS 1% + PLTM 10%, G4: HSA 5% + ITS 5% + PLTM 5%. Statistical comparison was made using ANOVA and Post Hoc tests.