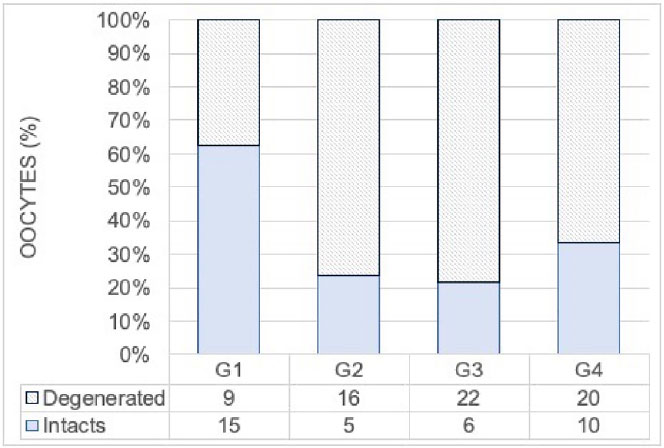
Figure 6. Distribution of intact and degenerated oocytes identified at the end of culture in the G1, G2, G3, and G4 groups. Comparison of groups was made by chi-square (χ2 (N=103,3) = 11.4, p=0.01).
Figure 6. Distribution of intact and degenerated oocytes identified at the end of culture in the G1, G2, G3, and G4 groups. Comparison of groups was made by chi-square (χ2 (N=103,3) = 11.4, p=0.01).