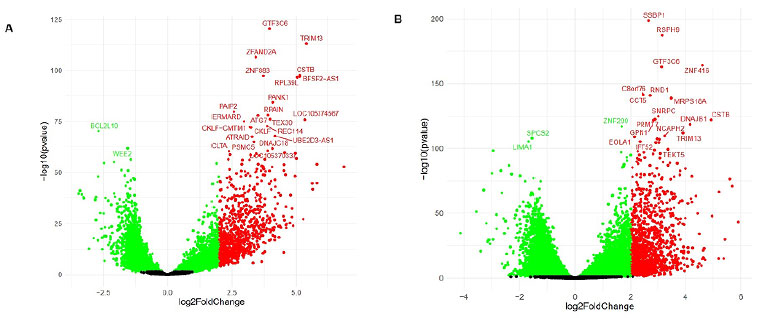
Figure 2. Volcano Plot of Differential Gene Expression in the Analyzed Datasets. Caption: It was observed the differential expression between GV and MII groups. In A, the magnitude of change in the GSE158802 dataset. The importance of the transition from the GSE95477 data set can be observed in B. All data was generated from the GEO2R web server. In red, the positively and in green, negatively regulated genes for the cutoff point p<0.05 and [log 2 FC] > 2.0.