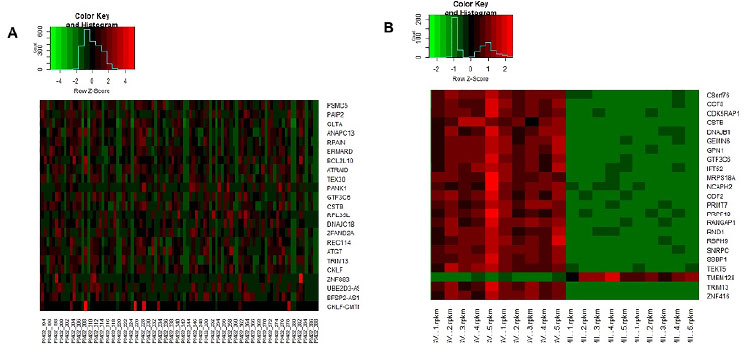
Figure 3. Heatmap and Expression of the Top 23 Genes in the Datasets. Caption: The expression of the top 23 genes in each dataset can be observed. The presentation by heat map in the GSE158802 dataset can be followed in A. In B, the expression of genes in the GSE95477 set can be observed. In red, positively regulated genes can be marked; in green, negatively regulated genes. The cutoff point adopted was p<0.05 and [log 2 FC] > 2.0. R Studio Software generated graphics.