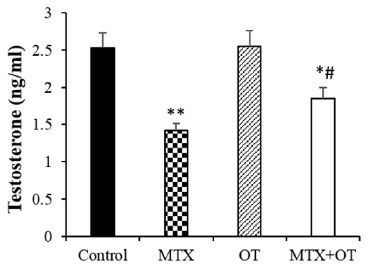
Figure 1. Testosterone levels in the different groups (Mean ± SD; n = 7). * & # p<0.05, ** p<0.001. The asterisk and # symbols indicate a comparison to the control and MTX-intoxicated groups, respectively.
Figure 1. Testosterone levels in the different groups (Mean ± SD; n = 7). * & # p<0.05, ** p<0.001. The asterisk and # symbols indicate a comparison to the control and MTX-intoxicated groups, respectively.