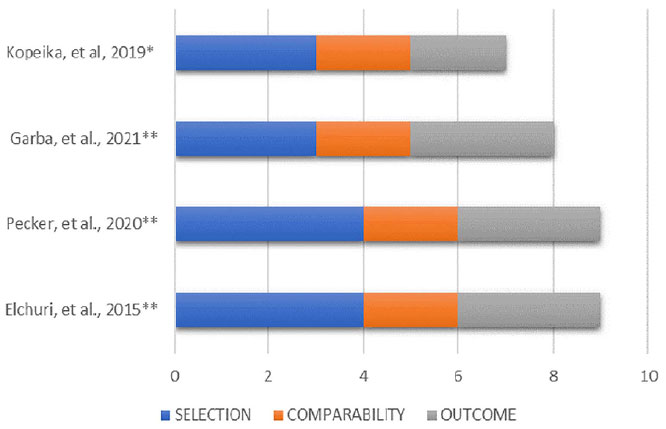
Figure 2. Risk of bias assessment based on the Newcastle-Ottawa scale.
* Study evaluated using the NOS scale (Score from 0 to 9 - the higher the score, the lower the risk of bias) (Wells et al., 2012).
** Studies evaluated using the NOS scale adapted for cross-sectional studies (Score from 0 to 10 - the higher the score, the lower the risk of bias) (Herzog et al., 2013).