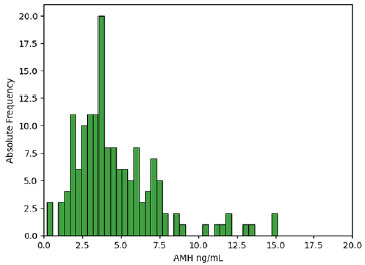
Figure 2.
Distribution of AMH values in the subgroup of women with exaggerated ovarian response.