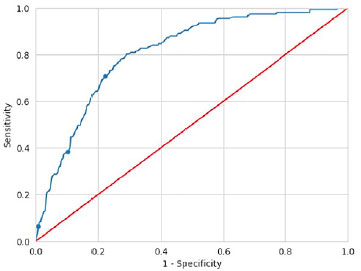
Figure 5. ROC curve differentiating exaggerated ovarian response according to the AMH value [area under the curve (AUC)=0.807; the marked points correspond to the cut-off values shown in Table 4].
Figure 5. ROC curve differentiating exaggerated ovarian response according to the AMH value [area under the curve (AUC)=0.807; the marked points correspond to the cut-off values shown in Table 4].