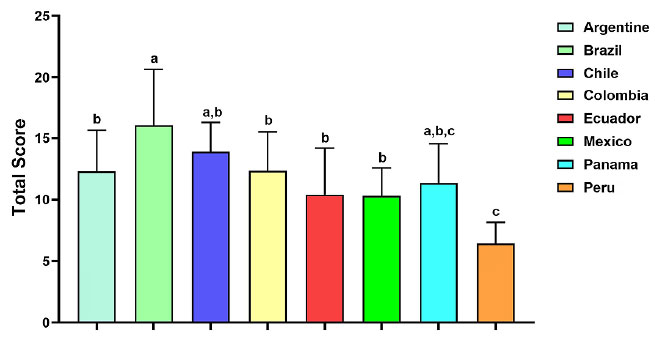
Figure 4. Total score of fertility clinics accredited by REDLARA per country. The data are graphed as mean±SD, one-way analysis of variance was used to compare the differences between the countries and that p<0.05 for statistical significance. The letters at the top of the bars (a, b, and c) mark significant differences of total score between the countries. Countries with the same letter, the difference between the means is not statistically significant. Countries with different letters, the total scores were significantly different.